
In the Australian Curriculum, children sort and compare data with real objects in Foundation, make one-to-one picture displays and tally marks in Year 1, and use lists and tables in Year 2. Column graphs and pictographs where one picture stands for several (a “many-to-one” scale) arrive in Year 4, the mode and line graphs in Year 5, and the range in Year 6. The mean and the median are not taught until Year 7. Victoria matches this year by year; NSW teaches picture graphs in Stage 1 and column graphs in Stage 2.
So a Year 5 child who has never heard the word “average” in maths is on track, and a Year 3 child who cannot read a graph where each picture means two is not behind either. The useful thing for a parent is the short list of mistakes that show where a child is stuck: counting pictures instead of reading the key, giving the count instead of the mode, finding the middle of a list that was never put in order, and believing a graph because it looks dramatic. This page sets out what each year asks for, those five mistakes, a two-minute check you can run with a packet of lollies, and a twenty-minute routine.
What the curriculum asks for, year by year
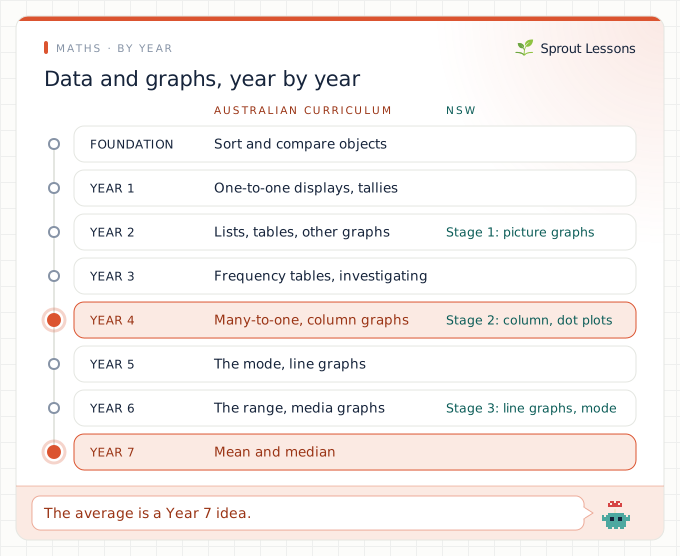
The Statistics strand has two or three descriptors a year. The ones that change what your child does, quoted from ACARA:
- Foundation, AC9MFST01: “collect, sort and compare data represented by objects and images in response to given investigative questions that relate to familiar situations”. Which do more of us like, apples or bananas? Line the fruit up and see.
- Year 1, AC9M1ST01 and AC9M1ST02: record data using “objects, images, drawings, lists, tally marks and symbols”, then “represent collected data for a categorical variable using one-to-one displays” and “compare the data using frequencies”. One-to-one means one picture for each person.
- Year 2, AC9M2ST01 and AC9M2ST02: “display data using lists and tables”, and “create different graphical representations of data”, comparing them.
- Year 3, AC9M3ST01: data for “categorical and discrete numerical variables”, recorded with “frequency tables and spreadsheets”. AC9M3ST03 adds the first “guided statistical investigations”.
- Year 4, AC9M4ST01: “represent data using many-to-one pictographs, column graphs and other displays or visualisations”. AC9M4ST02 asks children to judge which display works best and to “discuss the shape of distributions and the variation in the data”.
- Year 5, AC9M5ST01 and AC9M5ST02: “discuss and report on data distributions in terms of highest frequency (mode) and shape”, and “interpret line graphs representing change over time”.
- Year 6, AC9M6ST01 and AC9M6ST02: “compare distributions in terms of mode, range and shape”, and “identify statistically informed arguments presented in traditional and digital media; discuss and critique methods, data representations and conclusions”.
- Year 7, AC9M7ST01: “calculate the range, median, mean and mode” and decide which “measures of central tendency provide useful insights”. This is the first appearance of the mean and the median. AC9M7ST02 adds stem-and-leaf plots.
Where Victoria differs (the VCAA wording is paraphrased here, not quoted). Very little. The Victorian Curriculum carries the same descriptor at every level from Foundation to Level 8, with two small additions: its Foundation descriptor limits the first questions to ones with only two possible answers (VC2MFST01), and its Level 7 display descriptor names dot plots as well as stem-and-leaf plots (VC2M7ST02). Many-to-one pictographs and column graphs are Level 4 (VC2M4ST01), the mode Level 5 (VC2M5ST01) and the mean and median Level 7 (VC2M7ST01).
Where NSW differs (the NESA wording is paraphrased). The order is the same, but NSW is more specific about how a graph is drawn. In Stage 1 (Years 1 and 2), children put data into lists and tables and draw picture graphs with a baseline, equal spacing and same-sized symbols, and are already asked why some displays are misleading (MA1-DATA-01, MA1-DATA-02). In Stage 2, they draw column graphs with a scale of 1 and dot plots, mark equal intervals and label the axes, then move to many-to-one scales and spreadsheet graphs (MA2-DATA-01, MA2-DATA-02). In Stage 3, they choose their own scale, draw timelines, read line graphs and side-by-side column graphs, describe the range and the mode, and look for bias in media graphs (MA3-DATA-01, MA3-DATA-02). None of the Stage 1 to 3 Data pages mentions the mean or the median.
Five mistakes that tell you where your child is
1. The longer row wins (Years 1 and 2, Stage 1 in NSW)
Draw a picture graph of favourite fruit with big apples and small grapes, and a young child will often say more people chose apples because the apple row is longer, even when there are five apples and seven grapes. That is exactly why NSW insists on a baseline, equal spacing and same-sized symbols. The fix is to make two versions of the same graph, one fair and one not, and let your child count both. Once they have seen the trick, they spot it everywhere.
2. Counting the pictures, not reading the key (Year 4)
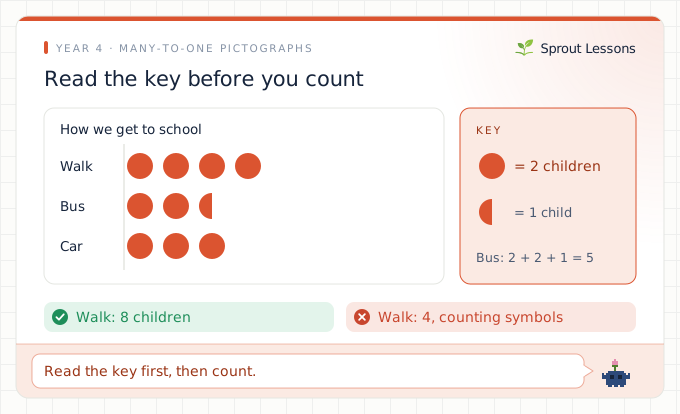
Year 4 is the first time one picture stands for more than one thing (AC9M4ST01). A pictograph where each symbol means two children shows four symbols next to “walk”, and the child says four. The half symbol next to “bus” is even harder: two and a half symbols is 5 children, and some children either skip the half or count it as one. The fix is a habit, not a lesson: before anyone reads a graph, they read the key out loud. Then count in twos, and ask what half of a symbol must be worth. Column graphs with a scale of 2, 5 or 10 are the same problem in a different shape.
3. The mode is 7 (Year 5)
Survey the family’s shoe sizes, or the class’s, and the most common size is 4, worn by seven people. Ask for the mode and many Year 5 children say 7. They have found the tallest column and read its height, which is the frequency, rather than its label, which is the value. The fix is to say the whole sentence: “the most common shoe size is 4; seven people wear it.” The mode is always one of the things you counted, never the count.
4. A graph that starts at 40 (Year 6)
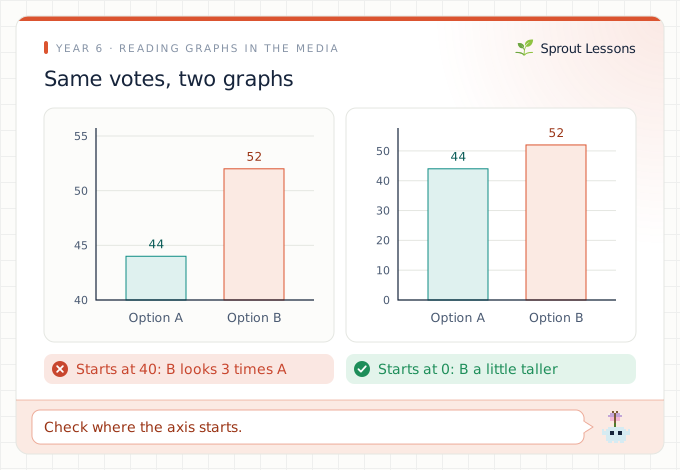
Year 6 asks children to “critique methods, data representations and conclusions” in the media (AC9M6ST02). The classic trick is a column graph whose vertical axis starts at 40 instead of 0: 52 votes then looks three times bigger than 44, when it is less than a fifth more. A child who reads the picture and not the numbers will say one option “won by heaps”. The fix is to find real graphs in the news, an ad or a sports broadcast, and ask two questions every time: where does the axis start, and what are the actual numbers?
5. The median of an unsorted list (Year 7)
Ask for the median of 3, 9, 4, 8 and 5, and a child who has just been taught it will often say 4, the middle number as written. The median is the middle once the list is in order: 3, 4, 5, 8, 9, so the median is 5. The same child may find the mean by adding the numbers (29) and forgetting to divide by five, which gives 5.8. Both are Year 7 content (AC9M7ST01), so a primary child who gets these wrong has not missed anything. For a Year 7 child, the fix is to write the ordered list every time, and to check that a mean is somewhere between the smallest and largest numbers.
A two-minute check with a packet of lollies
Tip a small packet of mixed lollies onto the table. Stop when one question goes wrong. Each question maps to a year.
- Foundation: Sort them by colour. Which colour has the most? How do you know?
- Year 1: Make a tally of the colours on paper. How many more red than green?
- Years 2 and 3: Put the tally into a table and draw a picture graph, one drawing per lolly, all the same size and lined up on a baseline.
- Year 4: Redraw it where one picture means two lollies. How do you show three? (One and a half pictures.)
- Year 5: Which colour is the mode? (A colour, not a number.)
- Year 6: What is the range of the counts? Draw a graph that makes the smallest colour look tiny, then explain how you cheated.
The first question that goes wrong is the place to start. A Year 6 child who can draw a misleading graph but answers question 5 with a number has the hard idea and is missing an easy one, which takes a week to fix, not a term.
Want practice set in their world? Sprout writes a maths lesson on AC9M4ST01 or AC9M5ST01 around what your child loves, from footy ladders to Minecraft mobs. Try it free.
Twenty minutes, mostly with real data
Data is the one maths topic where home has better material than a worksheet.
- Five minutes: ask a real question. Your child picks a question the family can answer (favourite cereal, how many minutes each of us reads), collects the answers and keeps a tally. Investigations start in Year 3, and owning the question is what makes the rest stick.
- Five minutes: one dataset, two graphs. Draw the answers as a picture graph and as a column graph, then talk about which is easier to read. That is AC9M4ST02 at the kitchen table.
- Five minutes: read the key first. Find a graph in a newspaper, a weather app or a footy ladder and, before anything else, read out the title, the axes and the scale.
- Five minutes: spot the trick. From Year 6, look for one graph a week that is trying to persuade you. Check where the axis starts and whether the pictures are the same size.
What is not the problem
- Not knowing the word “average” in primary school. The mean and the median are Year 7 in the Australian and Victorian curricula, and not in any NSW Stage 1 to 3 Data content.
- Only one-to-one graphs in Year 3. Many-to-one scales are Year 4 (Stage 2 in NSW, after column graphs with a scale of 1).
- Using a spreadsheet instead of drawing. The curriculum names spreadsheets and software from Year 2 onwards. Drawing by hand still helps with scales, but software is not cheating.
Where this sits
Data sits next to chance and probability by year, the other half of the Statistics and Probability strand. Reading a scale on a graph uses the same skill as reading a measuring jug, covered in measurement by year, and the mean leans on division and decimals. For the whole picture of the year column graphs arrive, see what a Year 4 student should know, or the teacher-facing Year 4 maths codes. If you are not sure which curriculum applies, start with which curriculum your state uses.
The short version
- Foundation to Year 2: sort real objects, tally, one picture per person, lists and tables.
- Year 3: frequency tables and the first investigations.
- Year 4: one picture for several (many-to-one), and column graphs. Read the key first.
- Year 5: the mode and line graphs. Year 6: the range, and spotting misleading graphs.
- Year 7: the mean and the median, in every curriculum. Victoria matches the Australian Curriculum; NSW teaches picture graphs in Stage 1.
Sprout makes a lesson on the exact code your child is working on, with data from their own interests. Start free.
How this page was checked
The Australian Curriculum descriptors are quoted from our copy of version 9.0, which matches AC9M4ST01 on the Australian Curriculum website; we read every Foundation to Year 8 Statistics descriptor. The Victorian codes are from the Victorian Curriculum F–10 version 2.0. The NSW findings come from the seven Data content pages from Early Stage 1 to Stage 3 of the NSW Mathematics K–10 Syllabus, read on 29 October 2026. Victorian and NSW wording is paraphrased. Checked 29 October 2026.
Australian Curriculum content descriptions are © Australian Curriculum, Assessment and Reporting Authority (ACARA) 2010 to present, licensed under CC BY 4.0, and quoted here unmodified. ACARA does not endorse any product that uses the Australian Curriculum. Victorian Curriculum codes reference the Victorian Curriculum F–10 Version 2.0 © VCAA, paraphrased; the VCAA does not endorse this product. NSW outcome codes reference the NSW syllabuses © NSW Education Standards Authority (NESA) for and on behalf of the Crown in right of the State of New South Wales, paraphrased, available at curriculum.nsw.edu.au; NESA does not endorse this product.
FAQ
What year do kids learn column graphs in Australia?
Year 4 in the Australian Curriculum and the Victorian Curriculum, along with pictographs where one picture stands for several things (AC9M4ST01). NSW starts column graphs with a scale of 1 in Stage 2 (Years 3 and 4), then moves to many-to-one scales. Before that, children make picture graphs, lists and tables.
When do kids learn mean, median and mode?
The mode comes first, in Year 5 (AC9M5ST01), and the range in Year 6. The mean and the median are first taught in Year 7 (AC9M7ST01) in the Australian Curriculum and at Level 7 in Victoria. None of the NSW Stage 1 to 3 Data content mentions the mean or the median.
Why does my child give the wrong answer for the mode?
Most often they read the height of the tallest column, which is the frequency, instead of its label, which is the value. If seven people wear shoe size 4, the mode is 4, not 7. Saying the whole sentence, the most common size is 4 and seven people wear it, fixes it quickly.
How do I help my child read a pictograph key?
Make reading the key out loud the first step every time. In a pictograph where each symbol stands for 2 children, four symbols is 8 children and two and a half symbols is 5. Many-to-one keys are new in Year 4, so counting symbols is a normal first mistake.
When do kids learn about misleading graphs?
Year 6 in the Australian Curriculum, which asks students to critique data representations and conclusions in traditional and digital media (AC9M6ST02). NSW raises it earlier: Stage 1 asks why some displays are misleading, and Stage 3 looks for bias in media graphs.