
A PAT Maths result is four numbers, and only one of them measures your child: the scale score. The achievement band describes what that score usually means in skills, and the percentile and stanine rank it against other Australian students in a year level the school chose. If the score went up by two or three points since last year, that can be completely normal, because average growth on the PAT Maths scale shrinks every year after Year 1 and by Year 8 is about two points a year. That last fact is the one that causes the most needless worry, and it is not on the report.
PAT is ACER’s Progressive Achievement Tests, and ACER says they are sat in more than 6,000 Australian schools a year, with over 6.6 million tests completed in 2024. Victoria is its biggest user: of the 1,249,411 PAT Maths results in ACER’s latest national norm sample, 493,898, about 40 per cent, came from Victorian students, more than New South Wales and Queensland combined. So a Victorian parent can easily get a PAT report in the same year as NAPLAN and Essential Assessment. This page explains each number using ACER’s own published norms and guidance, shows where PAT Maths sits against the Victorian Curriculum, and says what is worth doing about a result and what is not.
The four numbers on a PAT Maths report
ACER’s parent guide, Understanding your child’s PAT report, lists what a student report contains. In plain terms:
- Scale score. The number of correct answers converted onto one long PAT Maths scale that runs from Year 1 to Year 10. ACER calls it “an estimate of where a student is in their learning progress”. It is not a percentage and not a mark out of anything. Because every PAT Maths test, easy or hard, reports on the same scale, it is the only number you can compare from one year to the next.
- Achievement band. A stretch of the scale with a written description of what students in it can typically do. ACER is explicit that students in the same band “are operating at approximately the same achievement level within a learning area regardless of their school year level”. A Year 6 and a Year 4 can share a band.
- Percentile rank. The percentage of Australian students in the chosen year level who scored lower. A 75th percentile against Year 3 means a higher score than 75 per cent of Year 3 students in ACER’s norm sample. It is a rank, not a score on the test.
- Stanine. The same ranking in nine coarse steps. Stanine 5 is the middle 20 per cent, stanines 4 to 6 together are the middle 54 per cent, and stanine 9 is the top 4 per cent. ACER says only “some PAT tests” give a percentile or stanine, so your report may not show one.
Two of those numbers are about your child (the scale score and the band). The other two are about your child compared with a group, and the group is a choice.
One score, three different percentiles
ACER’s 2026 norms document prints the conversion tables, and they make the point better than any explanation. On PAT Maths 5th Edition Test 5, a student who gets 20 questions right has a scale score of 125.9. Against Year 4 students that is the 64th percentile. Against Year 5 it is the 49th. Against Year 6 it is the 38th. Same child, same answers, same scale score, three very different-sounding results.
So before reacting to a percentile, find out which year level it was compared with. ACER’s report shows the percentile “in the displayed year level”, which the school sets. The norms were also collected from tests sat in October and November 2024, near the end of the school year, and ACER itself notes that students tested at the start of a year “would likely perform differently”. A Term 1 test compared against end-of-year norms for the same year level will tend to look lower than it is.
Why a small rise is often a normal year
This is the part almost no school letter explains. ACER publishes the national average PAT Maths scale score for each year level. Here are the 2026 figures, and the gap from one year to the next:
| Year level | Average scale score | Up from the year before |
|---|---|---|
| Year 1 | 99.5 | |
| Year 2 | 108.5 | 9.0 |
| Year 3 | 115.8 | 7.3 |
| Year 4 | 121.5 | 5.7 |
| Year 5 | 126.0 | 4.5 |
| Year 6 | 129.4 | 3.4 |
| Year 7 | 132.1 | 2.7 |
| Year 8 | 134.2 | 2.1 |
| Year 9 | 136.1 | 1.9 |
| Year 10 | 138.0 | 1.9 |
The yearly gain in the average falls from 9 points between Years 1 and 2 to under 2 points between Years 9 and 10. A Year 8 who went up 2 points has grown about as much as the typical Year 8. The same 2 points in Year 2 would be worth a conversation.
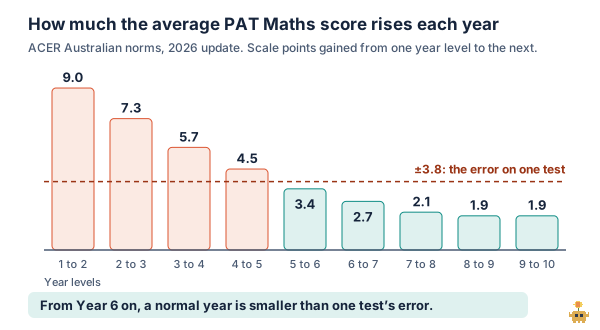
Now add the margin of error. Every scale score has one, and ACER prints it next to each score in the conversion tables. That raw score of 20 on Test 5 is 125.9 plus or minus 3.8. So from about Year 6 onwards, a normal year’s growth is smaller than the uncertainty on either test. ACER’s guide to interpreting results says it directly: “Small differences in scores should not be given more importance than they deserve.” The same guide recommends treating only a difference of two or more stanines as a real difference in performance.
In practice that means a single year-on-year comparison cannot tell you much in upper primary or secondary. Three or four results in a row, all heading the same way, can. A score that drops while the school’s other evidence says your child is fine is most likely noise, and a score that drops alongside a teacher’s concern is worth taking seriously.
The spread inside one year is bigger than a year of growth
The norms show one more thing worth knowing. In Year 4, the 25th percentile is 113.5 and the 75th is 129.5: a 16-point spread across the middle half of ordinary Year 4 students. The difference between an average Year 4 and an average Year 6 is 7.9 points. So the middle half of any one year level covers roughly two years of average growth, which is why a single class nearly always holds children working at what look like three different year levels. If your child’s percentile is 30, they are inside that middle half, not behind it. Our page on whether your child is behind in maths has a fuller way to tell.
PAT Maths and the Victorian Curriculum
PAT is a national test and is not written to the Victorian Curriculum. But in 2023 ACER ran a standard-setting workshop to estimate where the Victorian Mathematics achievement standards for Levels 1 to 6 fall on the PAT Maths scale, and published the result:
| Victorian Curriculum level | PAT Maths score at the cut | Australian average at that year (ACER’s table) |
|---|---|---|
| Level 1 | 97.5 | 99.5 (Year 1) |
| Level 2 | 107.6 | 108.3 (Year 2) |
| Level 3 | 112.9 | 115.4 (Year 3) |
| Level 4 | 120.4 | 121.1 (Year 4) |
| Level 5 | 127.4 | 125.5 (Year 5) |
| Level 6 | 134.9 | 128.9 (Year 6) |
Two things stand out. Up to Level 4, the cut sits close to the national average for that year, so an average PAT score is roughly “at the standard”. At Levels 5 and 6 the cut climbs faster than the average does, and by Level 6 it sits six points above the average Year 6 in ACER’s table. On this mapping, a perfectly typical Year 6 PAT score would be read as not yet at Level 6. That says more about how demanding the Level 6 standard is than about the child.
Treat these as estimates. Each cut has an error band (ACER gives ±1.0 at Level 1 and ±3.8 at Level 6), the averages in that table come from the earlier norms rather than the 2026 ones above, and ACER discusses possible effects of Victorian Mathematics Version 2.0 on the placements in its full report. ACER declined to publish an equivalent for PAT Reading at all, because the reading standards were too broad to pin to the scale. If your school reports a Victorian Level next to a PAT score, ask how it was worked out. For how Levels relate to years generally, see how the Victorian Curriculum is organised.
Want to see the questions behind a number, not just the number? Start free and give your child Sprout Tutor practice on the Victorian Curriculum. Every answer lands on your dashboard as the question itself, and it is free while in beta.
PAT is not NAPLAN, and not Essential Assessment
ACER’s parent information answers this one plainly: “There is no direct connection or alignment between PAT results and NAPLAN results.” The two use different scales and bands, and PAT is not meant to cover the whole curriculum for a year level. NAPLAN is a national test held in Years 3, 5, 7 and 9 (see what NAPLAN Year 3 actually tests). Essential Assessment is a pre and post test the school runs on each strand against the Victorian Curriculum. Three tests, three scales: a child can be “strong” on one and “average” on another in the same term without anything being wrong. If the numbers disagree, the teacher’s view of daily work is the tiebreaker.
What not to do
- Do not prepare for it. ACER’s words: “No special preparation for PAT is required or advised.” PAT is low stakes and exists to show the teacher where your child is. Coaching inflates the score and makes it less useful to the one person who reads it.
- Do not compare raw scores. 18 right on an easy test and 18 right on a hard one are different results. Only scale scores compare.
- Do not read one drop as a trend. See the margin of error above.
- Do not compare percentiles across different year-level groups. A 64th and a 49th can be the same performance.
Four questions for the teacher
- Which year level was the percentile compared against, and when in the year was the test?
- What is the scale score, and what was it last time? (The band and the score, not the percentile.)
- Which questions did my child get wrong that were below their score? ACER’s report shows every item with its difficulty on the same scale, so a miss well below the student’s score points at a specific gap.
- Does this match what you see in class? If not, which do you trust, and why?
Question three is the useful one. ACER’s parent guide says “you might expect to see more correct responses to items whose difficulty is lower than the student’s achievement, and fewer correct responses amongst items above”. An easy question missed is a lead. A hard one missed is just the test doing its job.
What to do at home with a result
If the result fits what the teacher sees, nothing urgent. If the teacher names a gap, practise that topic in short sessions a few times a week and let the next test confirm it or not. A PAT report shows the item descriptions, but not the wrong answer your child actually gave or why. That is the part daily practice can supply.
Sprout Tutor, which we build, is one way to do it for a Victorian child. It works from the Victorian Curriculum codes in Years 1 to 10, your child unlocks it with a PIN you set, and your parent dashboard shows each recent question as it was shown, the answer given, and whether the hint was used. It moves your child up a tier after three right in a row and down after five wrong, by fixed rules rather than a model’s guess, and logs every change of working Year. It is not a PAT score and does not try to be one, and like all personalised-learning software its effectiveness has not been independently established. How Sprout Tutor works walks through it.
How this page was checked
Checked 13 October 2026 against ACER’s own documents: the parent information sheet and Understanding your child’s PAT report (both 2024), the PAT Maths Australian norms (January 2026 update, data from October and November 2024), ACER’s 2011 Interpreting ACER Test Results (for the stanine table and the two-stanine guidance; its example scale scores use an older scale and are not quoted here), and PAT scales and Victorian Curriculum achievement standards (updated 5 November 2024). We are not affiliated with ACER, and ACER has not reviewed this page. Sprout Tutor is in public beta, follows the Victorian Curriculum only, and is free on every plan while in beta.
Got a PAT report and a gap the teacher named? Start free and put ten Victorian Curriculum questions on it tonight.
FAQ
What is a good PAT Maths scale score?
It depends on the year level and the time of year. In ACER's 2026 Australian norms, from tests sat in October and November 2024, the average scale score is 99.5 in Year 1, 115.8 in Year 3, 126.0 in Year 5, 132.1 in Year 7 and 138.0 in Year 10. The middle half of students in any one year spans about 16 to 19 points, so a score well below the average can still be ordinary.
My child's PAT Maths score only went up 2 points. Is that bad?
Not necessarily. Average growth on the PAT Maths scale shrinks every year: 9 points from Year 1 to Year 2, 4.5 from Year 4 to Year 5, and about 2 points a year from Year 7 onwards. Every score also carries a margin of error of roughly 4 points, so from about Year 6 a normal year's growth is smaller than the uncertainty on one test. Look at three or four results in a row, not one comparison.
What is the difference between a PAT percentile and a stanine?
Both rank your child's scale score against Australian students in a chosen year level. A percentile is the percentage who scored lower. A stanine groups the same ranking into nine steps: stanine 5 is the middle 20 per cent and stanine 9 the top 4 per cent. ACER recommends treating only a difference of two or more stanines as a real difference.
Is PAT the same as NAPLAN?
No. ACER says there is no direct connection or alignment between PAT and NAPLAN results. They use different scales and bands, and PAT is not designed to cover the whole curriculum for a year level. It is normal for a child to look stronger on one than the other.
Should my child prepare for a PAT test?
No. ACER says no special preparation is required or advised. PAT is low stakes and exists to show the teacher where your child is now, so coaching for it only makes the result less useful.