
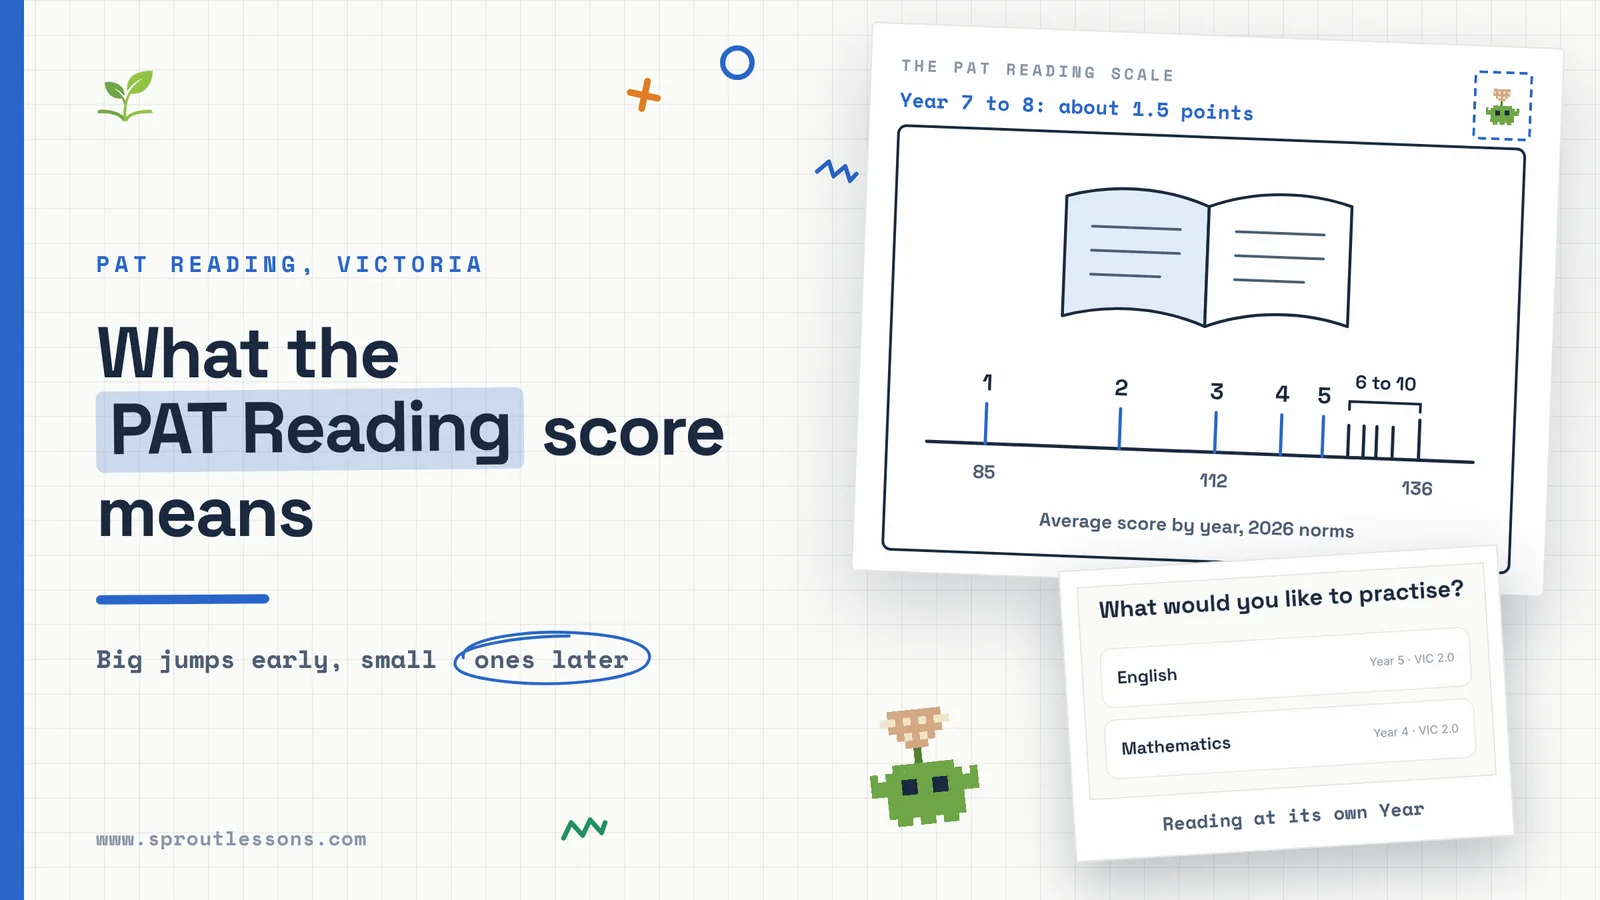
A PAT Reading result is a scale score, an achievement band, and sometimes a percentile or stanine. Only the scale score measures your child, and it can only be compared with other PAT Reading scores, never with PAT Maths. Reading growth on the scale is fast in the early years (about 16 points from Year 1 to Year 2) and almost flat in secondary school (about 1.5 points from Year 7 to Year 8), so a small rise in Year 7 or 8 is usually a normal year, not a problem. Neither fact is printed on the report, and they are the two that cause most of the worry.
PAT is ACER’s Progressive Achievement Tests, and Victoria uses PAT Reading more than anywhere else in the country. Of the 1,240,647 results in ACER’s 2026 PAT Reading norm sample, 489,542, about 39 per cent, came from Victorian students: more than New South Wales and Queensland put together. This page explains each number on the report using ACER’s own 2026 norms and band descriptions, shows what a normal year of reading growth looks like, and says what to ask the teacher and what to do at home. If your child also brought home a maths report, our page on PAT Maths results is the companion to this one.
What each number on the report means
- Scale score. The number of questions your child got right, converted onto one long PAT Reading scale. Every PAT Reading test, easy or hard, reports on the same scale, which is what makes this the number to compare from one test to the next. It is not a percentage. ACER is explicit that “a score on a Reading scale, for example, has no meaning on the Maths scale”, so a reading score of 120 and a maths score of 120 say nothing about which subject is stronger.
- Achievement band. PAT Reading splits its scale into 10-point bands (90–99, 100–109, 110–119 and so on), each with a written description of what students in it can typically do. Students in the same band are working at roughly the same level whatever year they are in. A score of exactly 110 sits on a boundary, and ACER suggests reading the descriptions of both bands.
- Percentile rank. The percentage of Australian students in a chosen year level who scored lower. A 58th percentile against Year 5 means a higher score than 58 per cent of the Year 5 students in ACER’s sample.
- Stanine. The same ranking in nine coarse steps, where stanine 5 is the middle 20 per cent. Not every report shows one.
ACER’s own norms document is blunt about the limits of the last two: norm comparisons “do not indicate the skills or knowledge that can be expected of the student”, and they cannot be used to infer progress over time. For that, it says, the scale score and the band descriptions are the best measure.
What PAT Reading actually tests
ACER describes five strands. In plain terms:
- Decode: turning letters into sounds and words, and early concepts of print.
- Retrieve: finding a piece of information the text states directly, including when the question words it differently.
- Interpret explicit: working out what stated information means, summarising, and linking ideas across a paragraph or a whole text.
- Interpret implied: inferring something the text suggests but never says, often from clues scattered through it.
- Reflect: mostly about the form of the text: its structure, features and conventions.
Two details in ACER’s band descriptions matter for parents. First, decoding is only described up to the 80–89 band. From 90 upwards every band says decoding is no longer described because students “have already developed sufficient fluency” to focus on comprehension. The average Year 1 student in the 2026 norms scores 85.3, so for most children from Year 2 on, the test is measuring understanding, not sounding out. But it is still a test your child reads alone. A child in Year 3 or 4 who is still decoding slowly will spend their effort on the words and score low on comprehension questions they could answer if the text were read to them. If a low score surprises you, ask the teacher whether reading speed and accuracy have been checked separately. Our page on phonics by year shows what decoding should be secure by when.
Second, PAT Reading is multiple choice, and ACER notes that this format cannot assess the reasons behind a student’s own judgement of a text. What it can do very well is offer answers that sound right but are not supported by the text. ACER’s description of the 120–129 band includes learning “to discount inferences that may appear plausible but are not supported by the text”. That single skill separates a lot of children in the middle of primary school, and it is the one most worth practising at home (more on that below).
A normal year of reading growth
ACER publishes the average PAT Reading scale score for each year level, from tests sat in October and November 2024. Here are the 2026 norms, with the gain from the year before:
| Year level | Average scale score | Up from the year before | Middle half of students |
|---|---|---|---|
| Year 1 | 85.3 | 74.2 to 96.4 | |
| Year 2 | 101.0 | 15.7 | 90.1 to 111.8 |
| Year 3 | 112.2 | 11.2 | 101.6 to 122.9 |
| Year 4 | 119.9 | 7.7 | 109.2 to 130.6 |
| Year 5 | 124.8 | 4.9 | 115.7 to 134.0 |
| Year 6 | 127.8 | 3.0 | 119.2 to 136.4 |
| Year 7 | 129.6 | 1.8 | 120.5 to 138.7 |
| Year 8 | 131.1 | 1.5 | 121.6 to 140.5 |
| Year 9 | 133.0 | 1.9 | 123.4 to 142.6 |
| Year 10 | 136.1 | 3.1 | 126.1 to 146.1 |
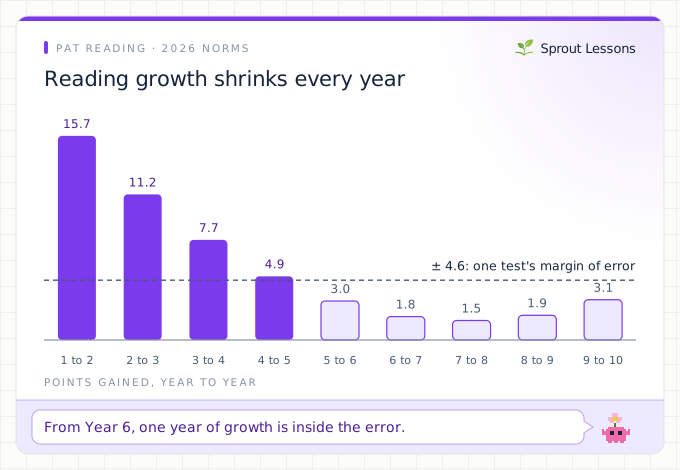
Read the table in three parts. Years 1 to 4 are where most of the measured growth happens, which is when children move from learning to read to reading to learn. A child who gains only 3 or 4 points across Year 2 has grown much less than usual, and that is worth a conversation. Years 5 and 6 slow to 3 to 5 points a year. Years 7 to 9 are nearly flat on average, under 2 points a year. A Year 8 who went up 1.5 points has done exactly what the average Year 8 does.
The last column matters as much. In Year 4, the middle half of ordinary students spans more than 21 points, from 109.2 to 130.6. The gap between an average Year 4 and an average Year 6 is 7.9. So a single Year 4 class normally holds children reading at what looks like three or four different year levels, and a child at the 30th percentile is inside that middle half, not behind it.
Every score has a margin of error
ACER prints a margin of error next to every scale score in its conversion tables. On PAT Reading 5th Edition Test 5, a common test for Year 5, 20 correct answers is a scale score of 127.8, plus or minus 4.6. That is a little wider than the equivalent on PAT Maths. Put the two facts together and from Year 6 on, a normal year’s growth is smaller than the uncertainty on either test. One year-on-year comparison in upper primary or secondary school cannot tell you whether your child grew. Three or four results in a row, heading the same way, can.
Why a strong reader’s score can go down
ACER studied 391,223 PAT Reading results from students who sat two tests between 6.5 and 24 months apart, and published the model. Its central finding is that gain depends heavily on where a student started: the higher the first score, the smaller the typical gain. For Year 8 Reading, the published model takes about a quarter of a point off the predicted gain for every point of the starting score.
We ran ACER’s published Year 8 Reading figures for a 12-month gap. A Year 8 who started at 110 is predicted to gain about 6.7 points. One who started at the average, around 131, about 1.4. One who started at 150 is predicted to come out about 3.4 points lower. That is not the strong reader getting worse. It is the margin of error at work: some of a very high first score was luck on the day, and the second test tends to pull back towards the middle. ACER’s guidance for a score that does drop is that “we would not assume that their learning progress has reversed. Rather, we take it that no progress has been measured”.
Two cautions on those numbers. They come from 2020 and 2021 data on one year level, and ACER’s report says the starting score and the time between tests explain only about 11 per cent of the variation in Year 8 Reading gain. They show the shape, not a target for your child.
One score, three percentiles
The same conversion table shows why the percentile on its own can mislead. A raw score of 20 on Test 5 is a scale score of 127.8. Against Year 4 students, ACER’s table puts that at the 69th percentile. Against Year 5, the 58th. Against Year 6, the 49th. Same child, same answers, three results that sound quite different.
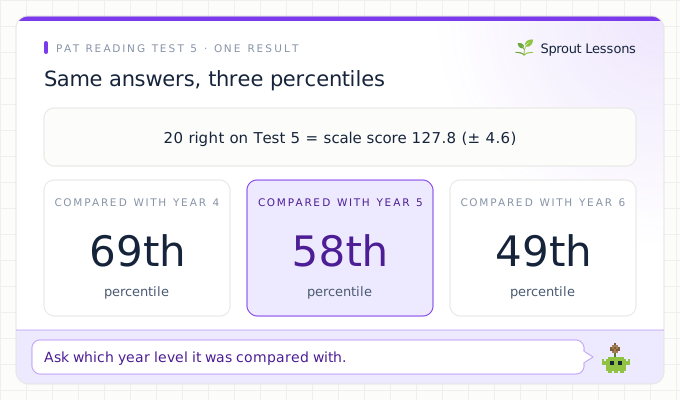
So ask which year level the percentile was compared with. Ask too when the test was sat: the norms come from October and November, and ACER says a student tested at the start of a year “would likely perform differently”. A Term 1 test read against end-of-year norms tends to look lower than it is.
One more trap is new this year. In January 2026 ACER replaced the 2022 norms with the 2026 ones, for every test in the system, including tests sat years ago. The 2026 averages are slightly lower at most year levels (by up to two points, and 4.4 points in Year 10), and the spread is wider. So a percentile on an old report may not match what the school’s system shows for the same test today. The scale score has not changed. Only the comparison group has.
PAT Reading and the Victorian Curriculum
If you were hoping to turn a PAT Reading score into a Victorian Curriculum level, ACER tried and decided not to. In 2023 it ran a workshop to place the Victorian achievement standards on its scales. It published the cut scores for Maths, but for Reading it concluded that “it is not appropriate to release the alignment”. The main difficulty, ACER wrote, was the broadness of the reading standards and how little they say about how reading skills progress. So if a report or a tutor gives you a Victorian Level for English based on a PAT Reading score alone, ask how it was worked out. For what the Levels themselves mean, see how the Victorian Curriculum is organised and how to read a Victorian school report.
PAT is not NAPLAN either. ACER’s parent information says there is “no direct connection or alignment between PAT results and NAPLAN results”, and NAPLAN Reading uses its own scale and proficiency levels. A child can be “Strong” on NAPLAN and at the 40th percentile on PAT in the same year without anything being wrong.
Want to see how your child reads a question, not just the score? Start free and give them Sprout Tutor English practice on the Victorian Curriculum, free while in beta.
Four questions for the teacher
- Which year level was the percentile compared with, and in which term was the test sat?
- What is the scale score, and what were the last two? (Scores, not percentiles.)
- Which questions did my child miss that were below their score, and which strand were they in? ACER’s report places every question on the same scale, and a student should usually get most of the questions below their own score right. A cluster of easy misses in one strand, say Retrieve, points at something specific.
- Has my child’s reading accuracy and speed been checked separately? If decoding is slow, the comprehension score understates what they understand.
What not to do
- Do not compare reading and maths scores. They are different scales with different units.
- Do not prepare for it. ACER advises no special preparation. PAT is low stakes, and a coached score is less useful to the teacher reading it.
- Do not read one drop as a trend, especially from Year 6 on and especially for a child who scored high last time.
- Do not compare raw scores. 20 right on Test 3 is a scale score of 106.5; 20 right on Test 6 is 127.8. Only scale scores compare.
What to do at home
If the result matches what the teacher sees, keep reading together and do nothing special. If the teacher names a strand, the most useful habit at home is the one PAT Reading rewards most: after your child answers a question about a book, ask “where does it say that?” If they can point to the words, the answer is retrieved or interpreted. If they point to a clue and explain it, it is a sound inference. If they say “it doesn’t say, but it would be true”, they have just picked a plausible answer the text does not support, which is exactly the distractor a multiple-choice test is built around. A few minutes of that, a few nights a week, with books your child chose, does more than any practice test. Our reading comprehension by year page shows what each year adds.
Sprout Tutor, which we build, is one way to add short practice for a Victorian child. It follows the Victorian Curriculum in English, maths and science from Foundation to Year 10, and your parent dashboard shows each question as it was shown, the answer your child gave and whether they used the hint, which is the part a PAT report leaves out. It is not a PAT score and does not try to be one, and like all personalised-learning software its effectiveness has not been independently established. How Sprout Tutor works explains the levelling.
How this page was checked
Checked 3 November 2026 against ACER’s own documents: the PAT Reading Australian norms (2026 update, dated May 2026, data from October and November 2024), PAT Reading strands and achievement band descriptions (January 2023), both attached to Using results from PAT Reading 5th Edition; Predicting scale score gain in PAT Reading and PAT Maths (report dated April 2024; the 12-month figures above are our arithmetic from its published Year 8 Reading model); and PAT scales and Victorian Curriculum achievement standards. We are not affiliated with ACER, and ACER has not reviewed this page. Sprout Tutor is in public beta, follows the Victorian Curriculum only, and is free on every plan while in beta.
Got a PAT Reading report and a strand the teacher named? Start free and practise it in short Victorian Curriculum sessions this week.
FAQ
What is a good PAT Reading scale score?
It depends on the year level and when the test was sat. In ACER's 2026 Australian norms, from tests sat in October and November 2024, the average PAT Reading scale score is 85.3 in Year 1, 112.2 in Year 3, 124.8 in Year 5, 129.6 in Year 7 and 136.1 in Year 10. The middle half of students in one year level spans roughly 17 to 22 points, so a score well below the average can still be ordinary.
My child's PAT Reading score barely went up. Is that a problem?
Often not. Average growth on the PAT Reading scale is 15.7 points from Year 1 to Year 2 but only 3.0 from Year 5 to Year 6 and 1.5 from Year 7 to Year 8. A single score also carries a margin of error of around 4 to 5 points, so from Year 6 a normal year of growth is smaller than the uncertainty on one test. Look at three or four results in a row. A small rise in Year 2 or 3 is worth a conversation with the teacher; in Year 7 or 8 it is usually a normal year.
Why did my child's PAT Reading score go down?
A drop usually means no progress was measured, not that reading got worse. ACER's study of 391,223 PAT Reading results found that the higher a student's first score, the smaller the typical gain, and very high first scores tend to come back towards the middle on the next test because part of any score is luck on the day. ACER advises treating a drop as no measured progress and checking it against classwork.
Can I compare my child's PAT Reading and PAT Maths scores?
No. The two tests use different scales with different units. ACER says a score on the Reading scale has no meaning on the Maths scale, so a reading score of 120 and a maths score of 120 say nothing about which subject is stronger. Compare each one only with earlier scores on the same test.
What Victorian Curriculum level is my child's PAT Reading score?
There is no official answer. ACER mapped the Victorian Curriculum achievement standards onto the PAT Maths scale in 2023, but for Reading it decided it was not appropriate to release an alignment, because the reading standards were too broad to place on the scale. If a level is given to you from a PAT Reading score, ask how it was worked out.